

Hello reader! In this blog we will explore investing approaches that have been proven to work in the past and give insight into how they work so you can apply them yourself.

Buying assets cheap
Ben Graham’s classic net current asset value stocks
During the early 1930s Ben Graham developed a stock selection criterion, whereby he picked stocks priced at 66% or less of a company's underlying current assets (cash, receivables and inventory) net of all liabilities and claims to a company’s common stock (current liabilities, long-term debt, preferred stock, unfunded pension liabilities). These stocks are known as “net-nets”.

For example, lets say a company’s current assets (cash, receivables and inventory) are $100 per share.
Further, the sum of the company’s current liabilities, long-term debt, preferred stock, and unfunded pension liabilities is $40 share.
Now, the net current asset value per share can be worked out from the difference between these two - this would be $60 per share in this case.
Using Graham’s approach, you would pay no more than 66% of $60 for this stock - providing a margin of safety.
Henry Oppenheimer, an Associate Professor of Finance at the State University of New York at Binghamton, wrote a paper examining the investment results of stocks meeting Graham’s “net-net” criteria from 1970-1983. The mean return from net current asset stocks for the 13-year period was 29.4% per year versus 11.5% per year for the NYSE-AMEX Index.
“Net-net’ stocks can be difficult to find and are generally few and far between. They do however represent an advantage to the average investor operating with a small pool of capital, as typically “net-net’s” are micro-cap stocks that are too small to warrant any competition from professional investors.
Low price to book value
Price to book value can be a simple and quick method to screen companies that may be undervalued.
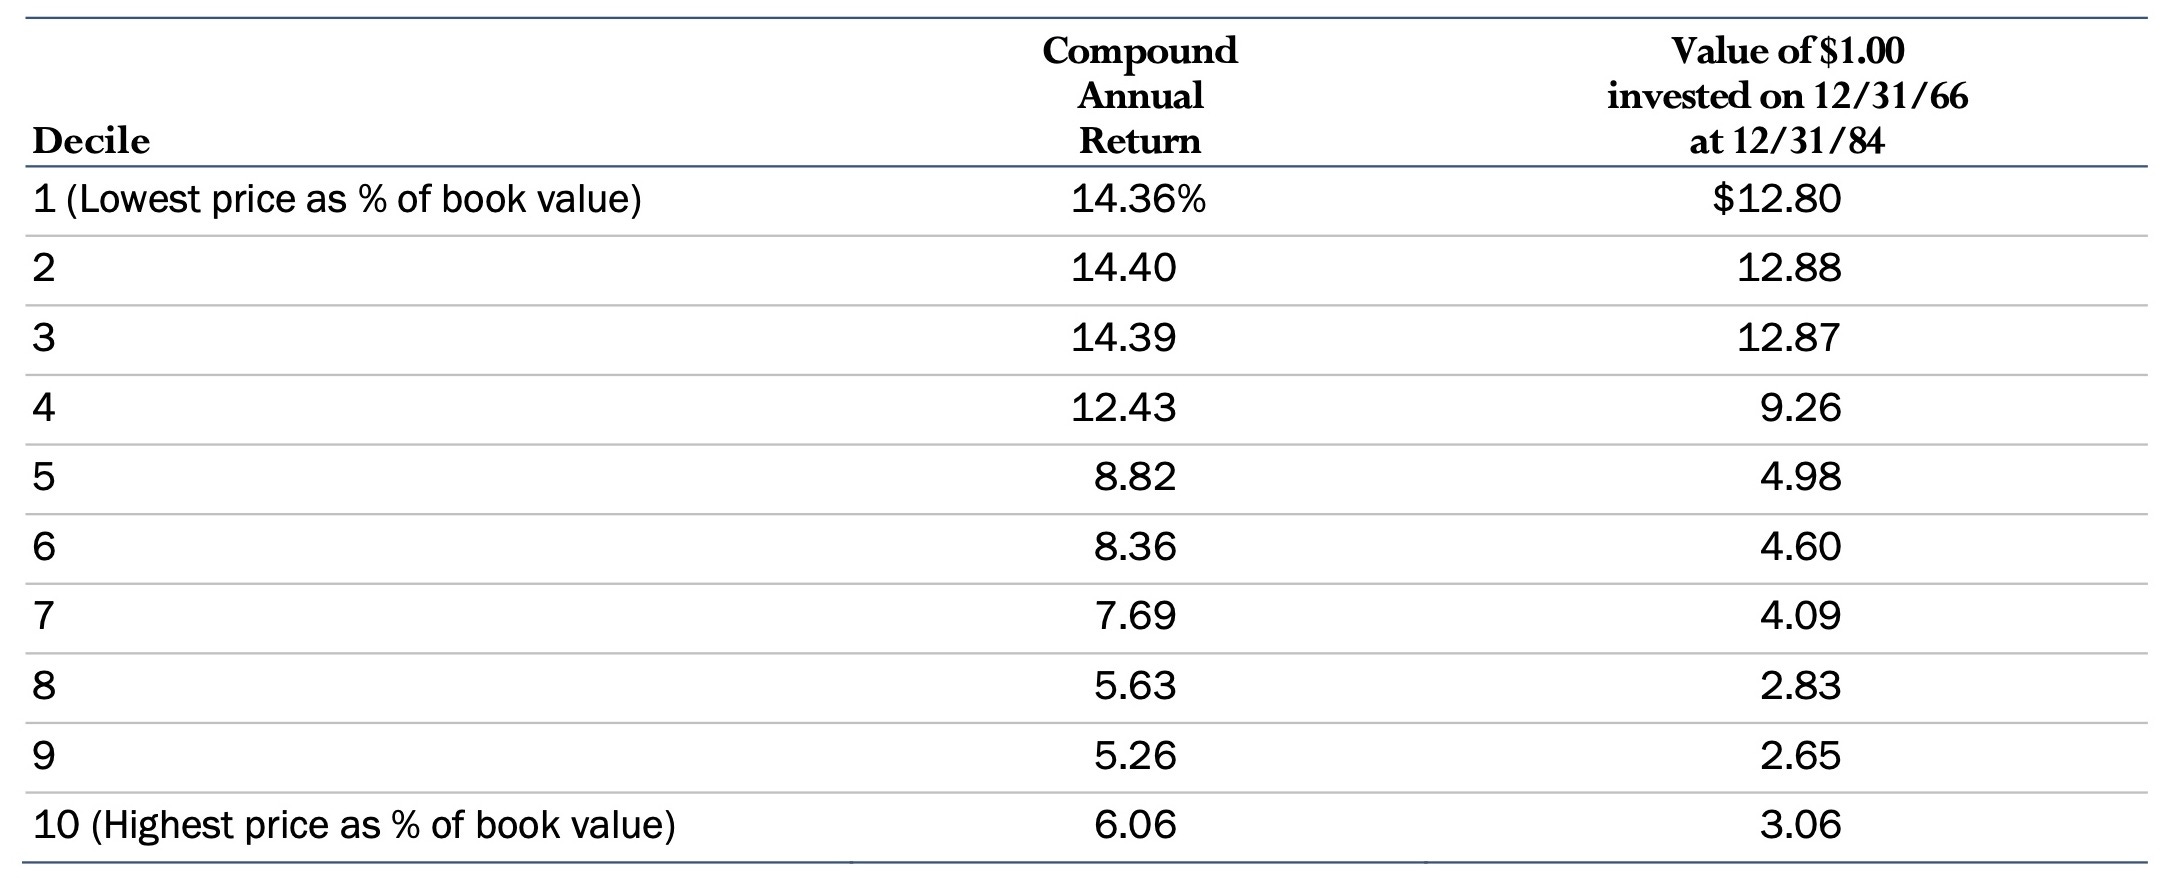
Roger Ibbotson, Professor at Yale School of Management wrote a paper comparing the investment returns of stocks trading at different price to book values. From 1966 to 1984 he took all stocks listed on the NYSE and ranked them into deciles, from stocks trading at the lowest price to book values to stocks trading at the highest price to book values.
Over this period - as shown in Table 1 - stocks with a low price to book value outperformed those with high price to book values.
In addition, the compound annual return for the NYSE Index over the same period was 8.6%, highlighting that the stocks in the lowest deciles outperformed the market over this period.
How to determine the price to book value of a stock?
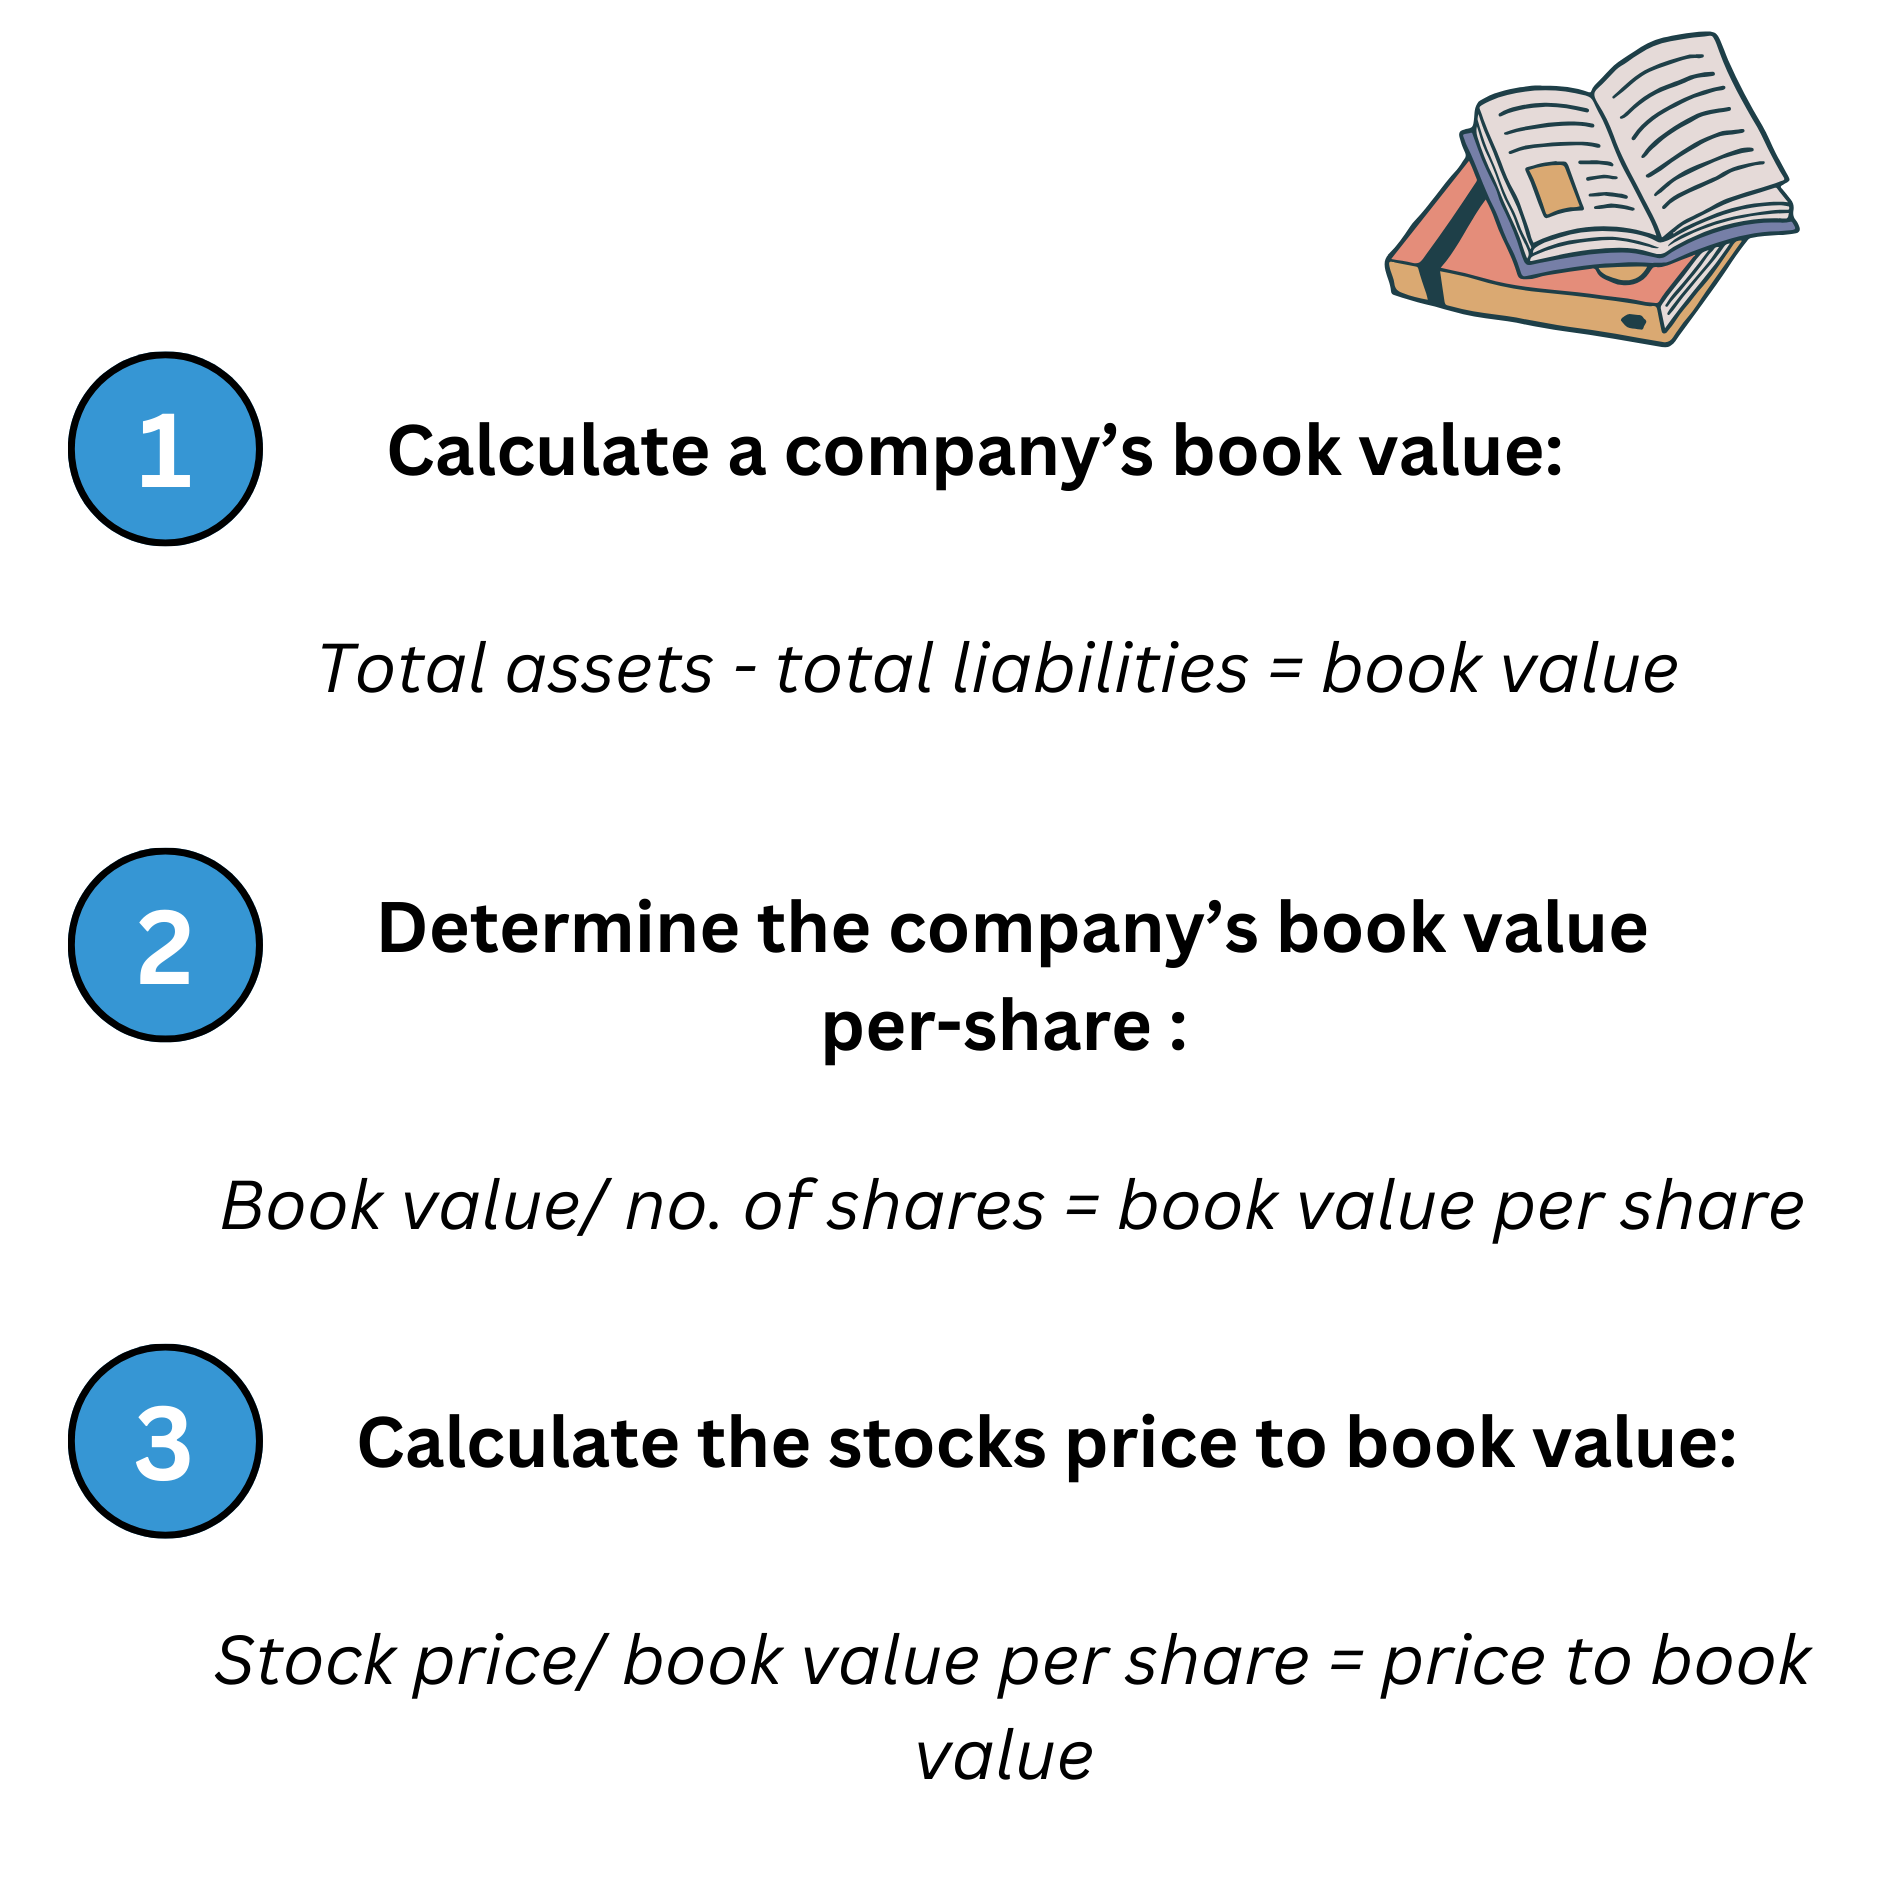
Following an investment approach squarely focused on price to book value should be done so with caution.
The drawback to book value is that it ignores things such as brand names or intellectual property (non-physical assets) that could have a big impact on the value of a business.
For instance, take a service based company where the majority of its assets are non-physical. This would give a high price to book value that may cause investors to assume it is overvalued and pass on the opportunity.
Buying earnings cheap
Low price to earnings
In a similar fashion to the analysis carried out on price to book value, Robert Ibbotson also ranked all NYSE listed stocks and sorted them into deciles based on their price to earnings ratios and measured their investment returns over 1966 to 1984.
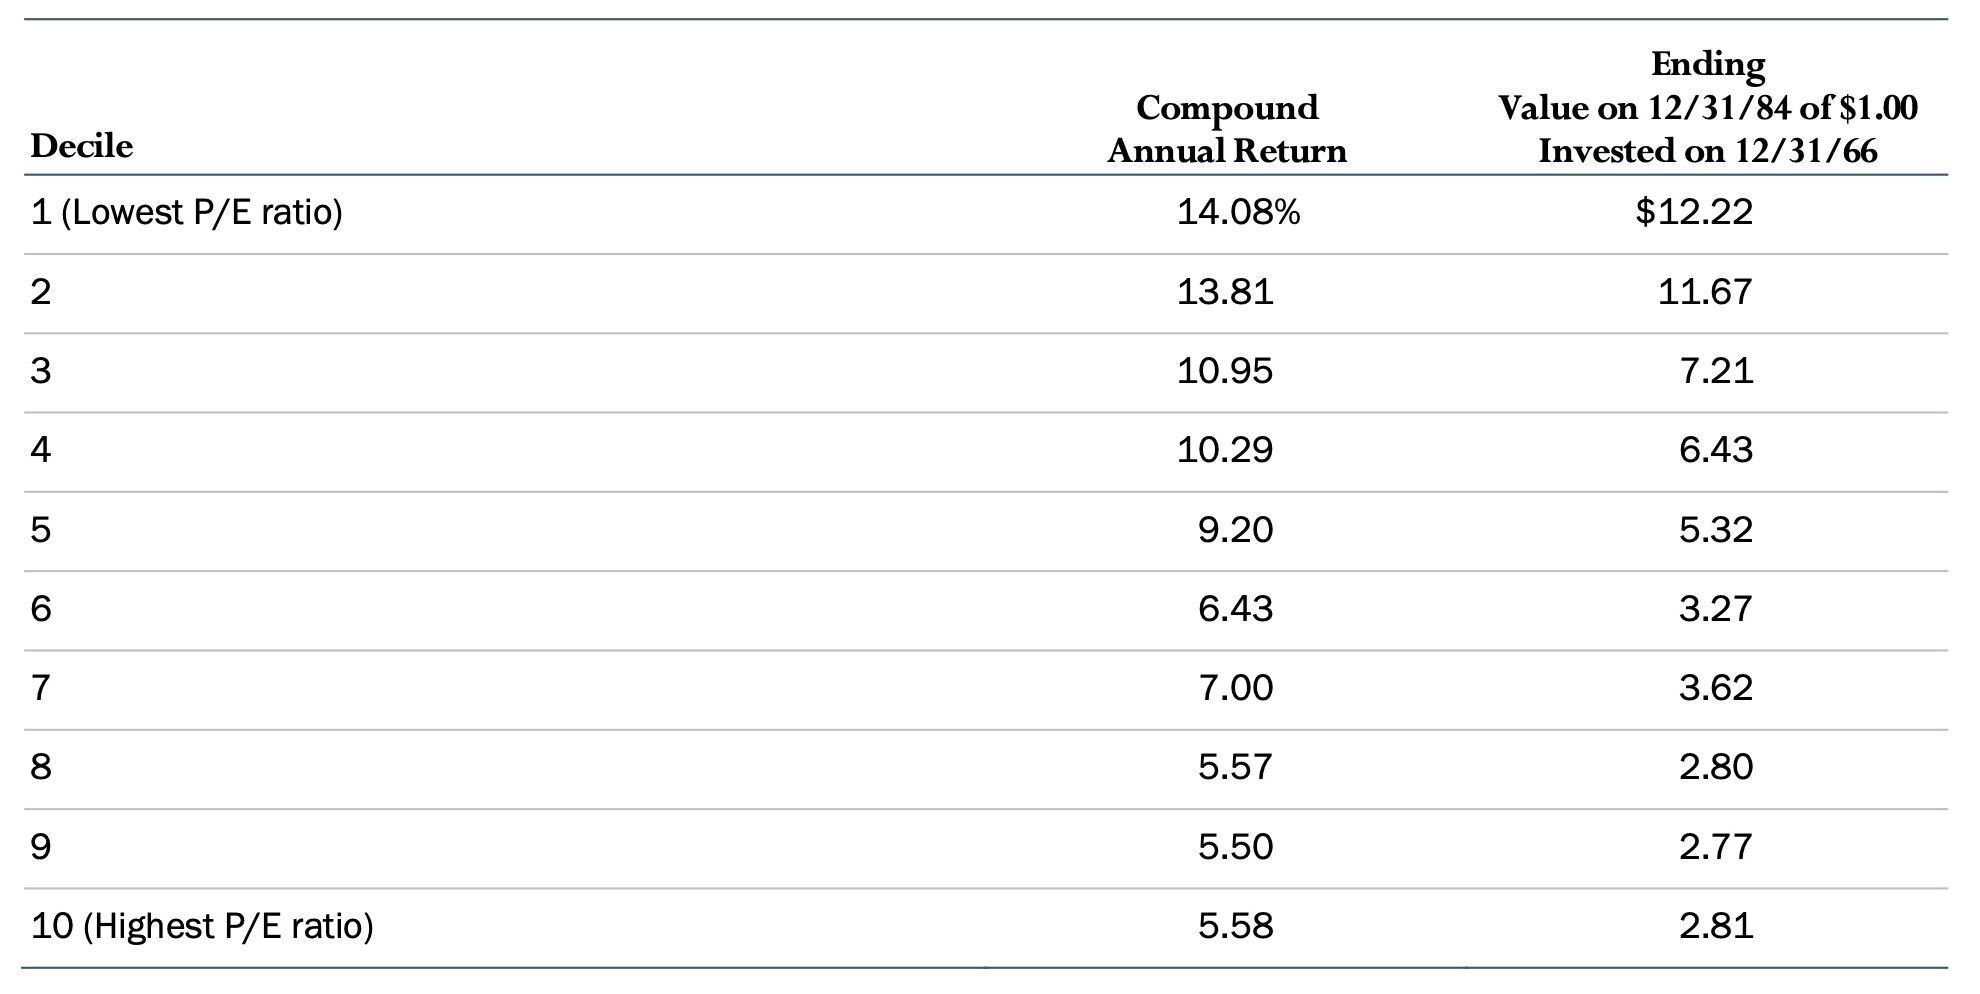
The data indicates that stocks in the lower price to earnings deciles performed better than those in the higher. Further, the returns for the market capitalisation weighted NYSE over the period was 8.6%.
Ben Graham’s low price to earnings framework
Graham’s framework selects stocks where the earnings yield ([earnings/ price] x 100) is at least twice the AAA bond yield, and the company’s total debt is less than its book value.
Further, Ben Graham also advised that a stock that meets this criteria be held for either 2 years, or until a 50% return is met - whichever occurs first.
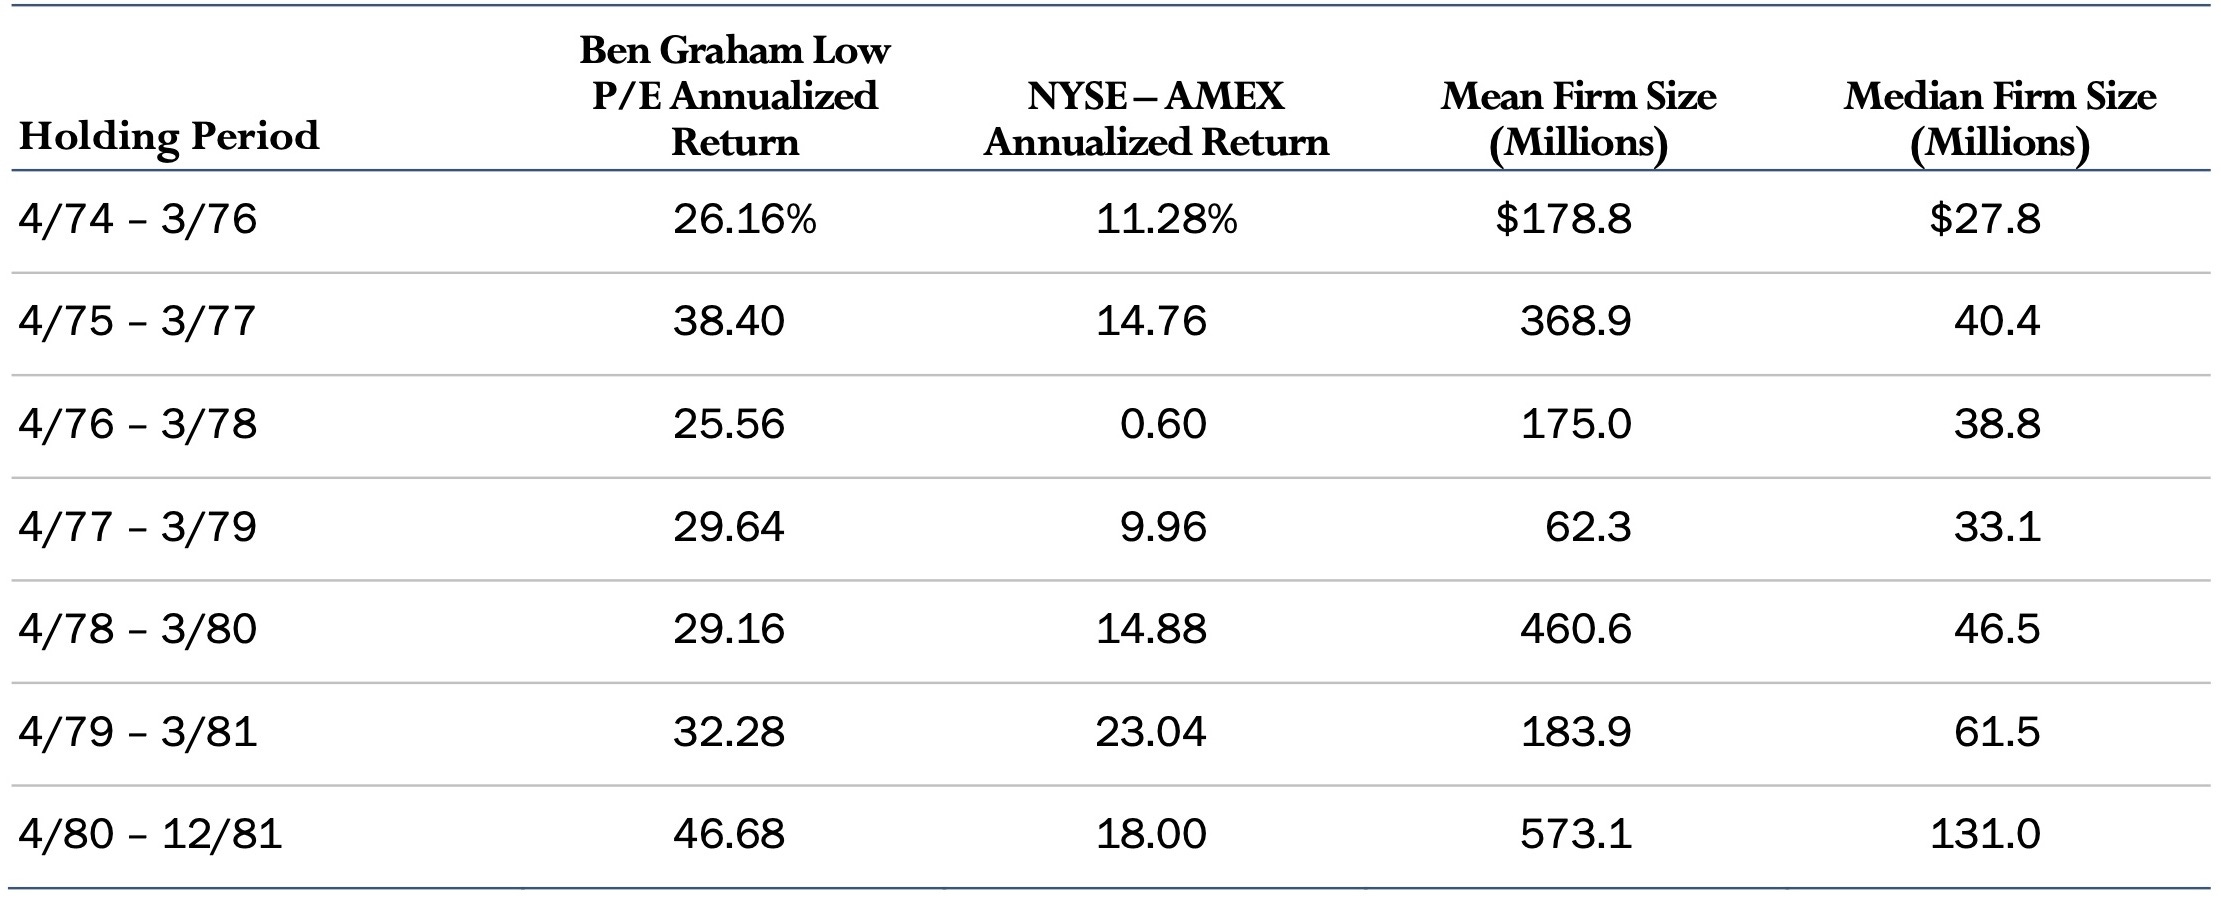
Henry Oppenheimer, of State University of New York at Binghamton, analysed New York and AMEX listed stocks that met Grahams framework from 1974 to 1980. Over the period, stocks that met Graham’s criteria achieved an average annual return of 38%, compared to 14% for the NYSE-AMEX index.
Low price to cash flow
In 1991, Michael Keppler evaluated the correlation between price to cash flow and investment returns over the period of 1970 to 1989.
Keppler took 18 national equity indexes and ordered them in terms of their price to cash flow ratio and placed them into quintiles each quarter. Then, over the subsequent quarter the investment returns were calculated.
The data showed that the most profitable approach was investing in the lowest price to cash flow quartile - producing a 19% compound annual return from 1970 to 1989, compared with 12.45% for the MSCI World Index over the same period. In this study, cash flow was defined as net earnings, after tax, interest, dividends on preferred stocks, distributions to employees, plus depreciation on fixed assets.
How Buffett determines cash flow
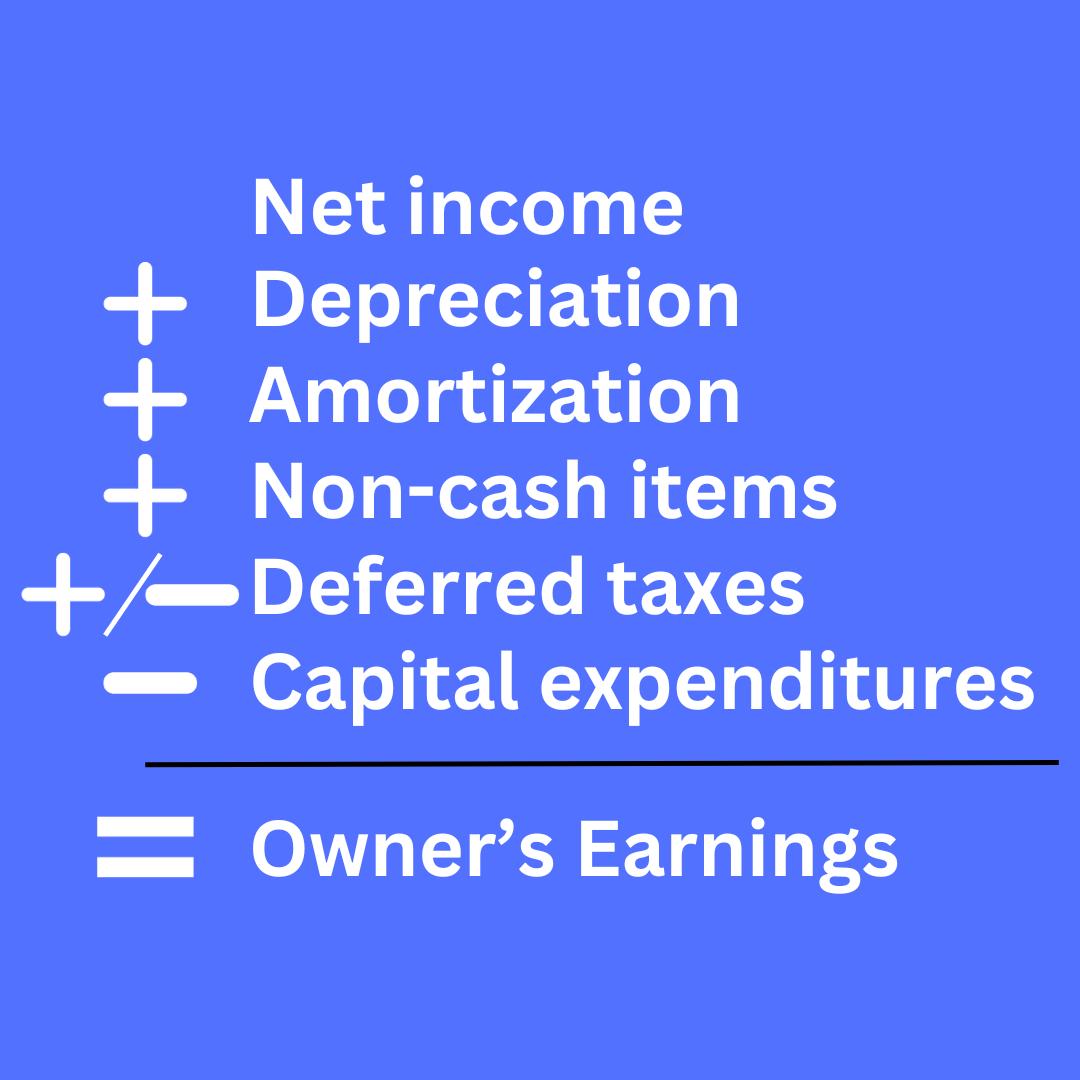
Buffett goes a step further when determining the cash flow of a business, including capital expenditure in the cash flow calculation - this gives us what Buffett calls “owner’s earnings”. This essentially tells us the amount of cash attributable to owners.

Warren Buffett’s “Owner’s Earnings” Calculation
Stocks that insiders are buying
Over the period of 1960-1965, Charles Devere Jr studied the investment returns of stocks that had high levels of corporate insiders buying the stock.
Devere Jr focused on stocks in which more than one insider had purchased the company's shares, and the number of insider purchases had significantly exceeded the number of insider sales during the same period.
The investment returns of the “insider stocks” over the 5 year period were 24.3% vs 6.1% for the market index.
Insiders often have “insight information” — knowledge about new marketing programs, product price increases, cost cuts, increased order rates, changes in industry conditions, etc. which they believe will result in an increase in the true underlying value of the company.Stocks with declines in price.
-Tweedy, Browne, What has worked in investing
Companies buying their own shares
Known as “cannibals” by legendary investor Mohnish Pabrai, companies partaking in large share re-purchase programs can outperform the market.
Fortune Magazine’s journalist Carol Loomis wrote an article in which 1,660 stocks were looked at and those which had purchased significant quantities of their own shares over 1974 to 1983 were assumed to be invested in on the date of the stock repurchase. The stocks in which large quantities of repurchasing had taken place produced an average compounded rate of return of 22.6% vs 14.1% for the S&P500.
Although cannibal stocks can produce high returns and share repurchase programs can be a tax efficient way to distribute cash to shareholders, care must be taken as management can conversely eat away at shareholder value if the repurchasing of shares is executed when shares are bought at a price greater than the intrinsic value.
Small market cap stocks
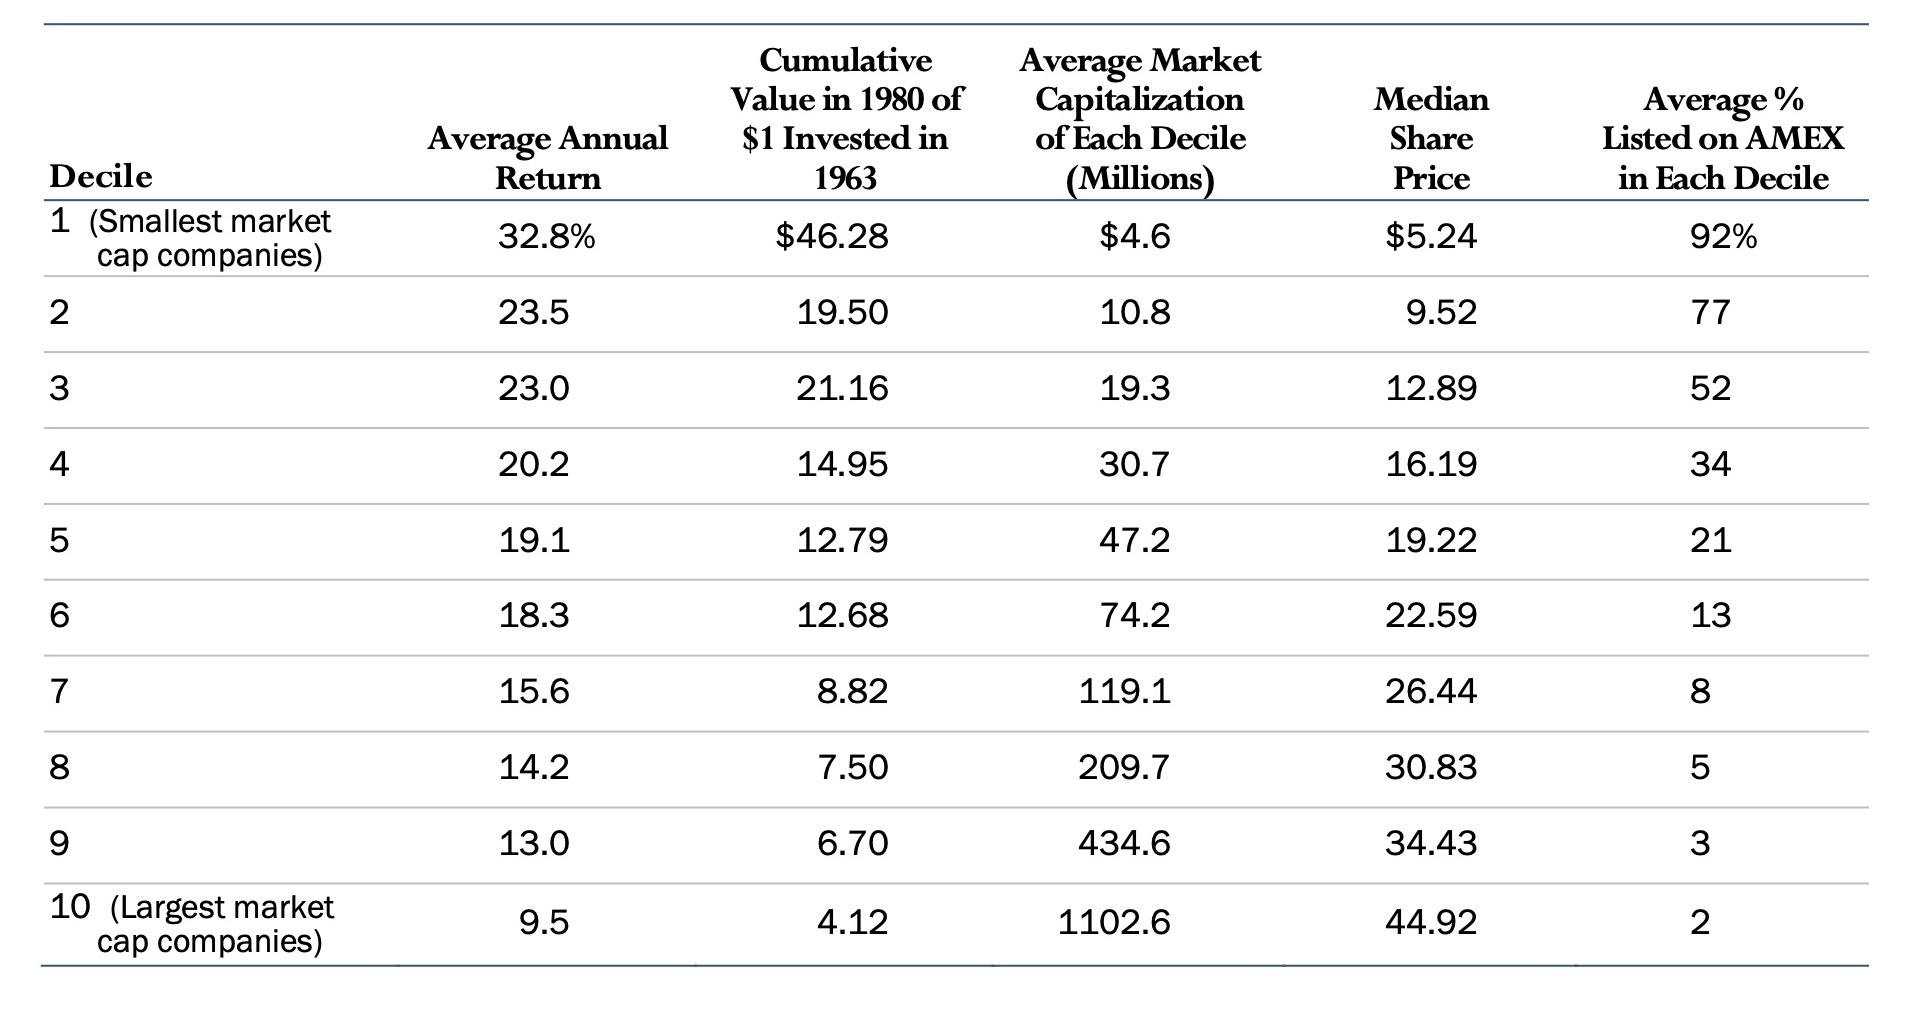
Marc Reinganum listed all stocks listed on the NYSE and AMEX and ranked them based on their market caps and placed them into deciles, over 1963 to 1980.
The average annual returns were calculated over the period. Stocks in the decile with the smallest market cap achieved an average annual return of 32.8% compared to 9.5% for the largest market cap companies.
Thanks for reading! I hope this blog was helpful and provided you with some useful ideas about how to approach investing.
Ref: What Has Worked in Investing: Studies of Investment Approaches and Characteristics Associated with Exceptional Returns. Copyright © 1992 by Tweedy, Browne Company LLC
Revised Edition. Copyright © 2009 by Tweedy, Browne Company LLC